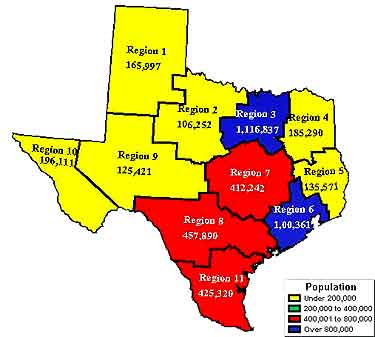
Texas Child Population Ages Birth to 13
By Region 1998
Total 4,330,548 |
 |
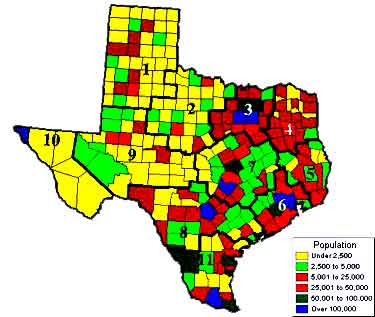
Texas Child Population Ages Birth to 13 |
|
Child Care Facilities in Texas by Fiscal Year |
|||||||||||
Year |
Day Care Facilities |
Residential Facilities |
Registered Family Homes |
Child Placing Agencies* |
Listed Family Homes |
||||||
1994 |
8,943 |
7,089 |
12,981 |
174 |
N/A |
||||||
1995 |
9,306 |
7,360 |
12,769 |
176 |
N/A |
||||||
1996 |
9,560 |
7,614 |
12,192 |
194 |
N/A |
||||||
1997 |
9,772 |
8,182 |
11,079 |
196 |
N/A |
||||||
1998 |
9,958 |
8,683** |
10,543 |
191 |
1,163 |
||||||
* A subset of Residential Facilities. ** Does not include 191 Child Placing Agencies. |
|||||||||||
Complaint Investigations in Child Care Facilities Fiscal Year 1998 |
||||||
Facility Type |
Total Facilities |
All Complaints (Standards Violations and Abuse /Neglect) Investigated |
Abuse/Neglect Complaints Investigated |
Valid Abuse /Neglect Complaints |
Non-valid Abuse /Neglect Complaints |
|
Licensed/Certified Facilities |
9,958 |
9,238 |
143 |
35 |
108 |
|
Registered Family Homes |
10,543 |
2,784 |
109 |
32 |
77 |
|
Residential Child Care Facilities * |
3,280 |
818 |
388 |
79 |
309 |
|
Facility Type Unknown |
NA |
NA |
517 |
95 |
422 |
|
Listed Family Homes |
1,163 |
26 |
26 |
14 |
12 |
|
Totals |
24,944 |
12,866 |
1,183 |
255 |
928 |
|
* Includes 191 Child Placing Agencies, but does not includes agency homes verified by Child Placing Agencies. |
||||||
Child Care Facilities in Texas At End of FY98 by Number, Capacity, and Percent of Change |
|||||||||||||
August 1997 |
August 1998 |
Percent of Change |
|||||||||||
Type of Facility |
Number of Facilities |
Capacity |
Number of Facilities |
Capacity |
Number of Facilities |
Capacity |
|||||||
Drop in Centers |
21 |
829 |
18 |
771 |
-14.29% |
-7.00% |
|||||||
Day Care Centers |
7,575 |
645,219 |
7,715 |
667,660 |
1.85% |
3.48% |
|||||||
Kindergartens/Nursery Schools |
305 |
19,776 |
276 |
17,641 |
-9.51% |
-10.80% |
|||||||
Schools/Kindergartens and Above |
80 |
6,958 |
72 |
6,963 |
-10.00% |
0.07% |
|||||||
Group Day Care Homes |
1,791 |
21,562 |
1,877 |
22,807 |
4.80% |
5.77% |
|||||||
Total Licensed/Certified Facilities |
9,772 |
694,344 |
9,958 |
715,842 |
1.90% |
3.10% |
|||||||
Registered Family Homes |
11,079 |
66,474 |
10,543 |
63,258 |
-4.84% |
-4.84% |
|||||||
Listed Homes |
N/A |
N/A |
1,163 |
3,489 |
N/A |
N/A |
|||||||
Total Day Care Facilities |
20,851 |
760,818 |
21,664 |
782,589 |
3.90% |
2.86% |
|||||||
Residential Licensing (24 Hour Care) Residential Child Care Facilities: |
|||||||||||||
Foster Group Homes |
41 |
466 |
38 |
446 |
-7.32% |
-4.29% |
|||||||
Foster Family Homes |
73 |
213 |
65 |
216 |
-10.96% |
1.41% |
|||||||
Institutions Providing Basic Care |
81 |
4,883 |
79 |
4,874 |
-2.47% |
-0.18% |
|||||||
Institutions Serving Mentally Retarded Children |
8 |
249 |
8 |
249 |
0.00% |
0.00% |
|||||||
Emergency Shelters |
68 |
1,552 |
70 |
1,623 |
2.94% |
4.57% |
|||||||
Halfway Houses |
3 |
90 |
4 |
102 |
33.33% |
13.33% |
|||||||
Residential Treatment Centers |
102 |
4,040 |
92 |
4,054 |
-9.80% |
0.35% |
|||||||
Therapeutic Camps |
8 |
454 |
9 |
469 |
12.50% |
3.30% |
|||||||
Total Residential Child Care Facilities |
384 |
11,947 |
365 |
12,033 |
-4.95% |
0.72% |
|||||||
Child Placing Agencies |
196 |
N/A |
191 |
N/A |
-2.55% |
N/A |
|||||||
Agency Foster |
2,472 |
10,434 |
2,489 |
7,883 |
0.69% |
-24.45% |
|||||||
Agency Foster Group |
192 |
1,803 |
235 |
2,185 |
22.40% |
21.19% |
|||||||
Total Agency Homes |
2,664 |
12,237 |
2,724 |
10,068 |
2.25% |
-17.72% |
|||||||
Total Residential Facilities, Child Placing Agencies and Agency Homes |
3,244 |
24,184 |
3,280 |
22,101 |
1.11% |
-8.61% |
|||||||
CPS Approved Foster Homes* |
3,163 |
10,107 |
3,348 |
10,449 |
5.85% |
3.38% |
|||||||
CPS Approved Adoptive Homes* |
1,764 |
N/A |
2,232 |
N/A |
26.53% |
N/A |
|||||||
Maternity Homes |
11 |
N/A |
14 |
N/A |
27.27% |
N/A |
|||||||
Child Care Administrators License |
1,381 |
N/A |
1,079 |
N/A |
-21.87% |
N/A |
|||||||
* CPS staff validate and assures these homes meet standards. |
|||||||||||||
Investigations of Complaints in Licensed or Certified Facilities by Fiscal Year |
|||||||||||||
Year |
Investigations |
||||||||||||
1993 |
9,273 |
||||||||||||
1994 |
9,576 |
||||||||||||
1995 |
9,887 |
||||||||||||
1996 |
10,986 |
||||||||||||
1997 |
10,497 |
||||||||||||
1998 |
12,840 |
||||||||||||
Child-Care Facility Inspections by Fiscal Year |
|||||||||||||
Year |
Investigations |
||||||||||||
1993 |
37,302 |
||||||||||||
1994 |
36,652 |
||||||||||||
1995 |
35,269 |
||||||||||||
1996 |
36,580 |
||||||||||||
1997 |
37,353 |
||||||||||||
1998 |
39,535* |
||||||||||||
* Includes 1,183 inspections made during abuse/neglect investigations and 11,534 investigations of alleged standards violations. |
|||||||||||||
Facilities Licensed, Regulated, and Certified by Fiscal Year |
||||||||
| Day-Care Facilities Licensed |
FY95 |
FY96 |
FY97 |
FY98 |
||||
|---|---|---|---|---|---|---|---|---|
Lubbock (1) |
402 |
411 |
411 |
414 |
||||
Abilene (2) |
310 |
321 |
339 |
339 |
||||
Arlington (3) |
2,302 |
2,370 |
2,396 |
2,385 |
||||
Tyler (4) |
434 |
457 |
481 |
478 |
||||
Beaumont (5) |
277 |
287 |
292 |
299 |
||||
Houston (6) |
2,039 |
2,085 |
2,124 |
2,185 |
||||
Austin (7) |
1,193 |
1,248 |
1,278 |
1,321 |
||||
San Antonio (8) |
905 |
909 |
947 |
955 |
||||
Midland (9) |
281 |
280 |
284 |
293 |
||||
El Paso (10) |
453 |
476 |
478 |
488 |
||||
Edinburg (11) |
710 |
716 |
742 |
801 |
||||
Total |
9,306 |
9,560 |
9,772 |
9,958 |
||||
| Registered Family Homes |
FY95 |
FY96 |
FY97 |
FY98 |
||||
Lubbock (1) |
473 |
441 |
401 |
416 |
||||
Abilene (2) |
364 |
348 |
315 |
322 |
||||
Arlington (3) |
3,602 |
3,466 |
3,234 |
3,197 |
||||
Tyler (4) |
292 |
269 |
260 |
272 |
||||
Beaumont (5) |
264 |
236 |
194 |
175 |
||||
Houston (6) |
3,834 |
3,525 |
3,000 |
2,766 |
||||
Austin (7) |
1,351 |
1,328 |
1,348 |
1,292 |
||||
San Antonio (8) |
1,143 |
1,098 |
1,010 |
992 |
||||
Midland (9) |
183 |
171 |
160 |
122 |
||||
El Paso (10) |
171 |
166 |
150 |
133 |
||||
Edinburg (11) |
1,092 |
1,144 |
1,007 |
856 |
||||
Total |
12,769 |
12,192 |
11,079 |
10,543 |
||||
Residential Licensing (24 Hour Care) |
FY95 |
FY96 |
FY97 |
FY98 |
||||
Lubbock (1) |
142 |
150 |
154 |
182 |
||||
Abilene (2) |
75 |
102 |
115 |
130 |
||||
Arlington (3) |
602 |
680 |
686 |
612 |
||||
Tyler (4) |
82 |
100 |
106 |
108 |
||||
Beaumont (5) |
44 |
52 |
53 |
72 |
||||
Houston (6) |
786 |
871 |
870 |
880 |
||||
Austin (7) |
574 |
630 |
609 |
598 |
||||
San Antonio (8) |
323 |
366 |
397 |
417 |
||||
Midland (9) |
56 |
58 |
48 |
51 |
||||
El Paso (10) |
71 |
82 |
91 |
82 |
||||
Edinburg (11) |
102 |
109 |
115 |
148 |
||||
Total * |
2,857 |
3,200 |
3,244 |
3,280** |
||||
* Does not include CPS Foster/Adoptive homes approved. ** Does not include 14 maternity homes. |
||||||||
Regulation of Day Care Facilities by Region for Fiscal Year 1998 |
|||||||||||||||
| Region |
01 |
02 |
03 |
04 |
05 |
06 |
07 |
08 |
09 |
10 |
11 |
Total |
|||
|---|---|---|---|---|---|---|---|---|---|---|---|---|---|---|---|
Applications Accepted |
128 |
86 |
441 |
112 |
96 |
506 |
284 |
208 |
72 |
97 |
237 |
2,267 |
|||
Provisional Licenses Issued (New Day Care) |
66 |
66 |
281 |
85 |
59 |
308 |
223 |
118 |
49 |
74 |
180 |
1,509 |
|||
Request to Register Granted (New Registered Family Home) |
110 |
104 |
630 |
54 |
42 |
547 |
343 |
219 |
27 |
17 |
130 |
2,223 |
|||
Adverse Actions-Licenses Denied |
|||||||||||||||
Day-Care |
0 |
0 |
0 |
0 |
0 |
0 |
0 |
0 |
0 |
0 |
0 |
0 |
|||
Registered Family Home |
1 |
0 |
0 |
0 |
0 |
0 |
0 |
0 |
0 |
0 |
0 |
1 |
|||
Adverse Actions-Licenses Revoked |
|||||||||||||||
Day-Care |
1 |
1 |
1 |
0 |
1 |
4 |
2 |
0 |
0 |
2 |
0 |
12 |
|||
Registered Family Home |
0 |
0 |
3 |
0 |
1 |
3 |
1 |
4 |
0 |
0 |
0 |
12 |
|||
Total Adverse Actions |
2 |
1 |
4 |
0 |
2 |
7 |
3 |
4 |
0 |
2 |
0 |
25 |
|||
Corrective Actions-Evaluation |
|||||||||||||||
Day-Care |
5 |
1 |
16 |
1 |
5 |
19 |
16 |
8 |
6 |
5 |
8 |
90 |
|||
Registered Family Home |
2 |
2 |
4 |
1 |
0 |
4 |
8 |
0 |
0 |
2 |
2 |
25 |
|||
Corrective Actions-Licenses Suspended |
|||||||||||||||
Day-Care |
0 |
0 |
0 |
0 |
0 |
1 |
0 |
0 |
0 |
0 |
3 |
4 |
|||
Registered Family Home |
0 |
2 |
5 |
0 |
0 |
0 |
0 |
0 |
0 |
0 |
7 |
||||
Corrective Actions-Probations |
|||||||||||||||
Day-Care |
1 |
0 |
10 |
1 |
2 |
6 |
5 |
3 |
4 |
2 |
2 |
36 |
|||
Registered Family Home |
0 |
2 |
1 |
2 |
1 |
4 |
3 |
0 |
0 |
0 |
2 |
15 |
|||
Corrective Actions-Corrective Denial |
|||||||||||||||
Day-Care |
3 |
0 |
4 |
0 |
0 |
4 |
0 |
3 |
0 |
2 |
1 |
17 |
|||
Registered Family Home |
0 |
0 |
1 |
0 |
0 |
0 |
1 |
0 |
0 |
0 |
0 |
2 |
|||
Total Corrective Actions |
11 |
7 |
41 |
5 |
8 |
38 |
33 |
14 |
10 |
11 |
18 |
196 |
|||
Complaint Investigations |
507 |
480 |
3,294 |
551 |
402 |
2,593 |
1,492 |
1,320 |
258 |
384 |
741 |
12,022 |
|||
Regulation of Residential (24 Hour) Facilities by Region for Fiscal Year 1998 |
|||||||||||||||
Region |
01 |
02 |
03 |
04 |
05 |
06 |
07 |
08 |
09 |
10 |
11 |
Total |
|||
Provisional Applications Accepted |
1 |
2 |
9 |
5 |
1 |
15 |
13 |
5 |
0 |
2 |
0 |
53 |
|||
Provisional Licenses Issued (New ) |
4 |
4 |
21 |
5 |
0 |
48 |
25 |
19 |
0 |
3 |
1 |
130 |
|||
Adverse Actions Licenses Denied |
0 |
0 |
0 |
0 |
0 |
0 |
1 |
0 |
0 |
0 |
0 |
1 |
|||
Adverse Actions Licenses Revoked |
0 |
0 |
0 |
0 |
0 |
0 |
0 |
0 |
0 |
0 |
0 |
0 |
|||
Total Adverse Actions |
0 |
0 |
0 |
0 |
0 |
0 |
1 |
0 |
0 |
0 |
0 |
1 |
|||
Corrective Actions Evaluation |
0 |
0 |
1 |
0 |
0 |
0 |
0 |
0 |
0 |
0 |
0 |
1 |
|||
Corrective Actions Licenses Suspended |
0 |
0 |
0 |
0 |
0 |
0 |
0 |
0 |
0 |
0 |
0 |
0 |
|||
Corrective Actions Probations |
1 |
1 |
0 |
0 |
0 |
0 |
1 |
2 |
0 |
0 |
0 |
5 |
|||
Corrective Actions Corrective Denial |
0 |
0 |
0 |
0 |
0 |
0 |
0 |
0 |
0 |
0 |
0 |
0 |
|||
Total Corrective Actions |
1 |
1 |
1 |
0 |
0 |
0 |
1 |
2 |
0 |
0 |
0 |
6 |
|||
Complaint Investigations |
50 |
27 |
82 |
10 |
1 |
197 |
252 |
154 |
6 |
6 |
33 |
818 |
|||