|
Risk Assessment Finding of Child Abuse /Neglect Fiscal Year 1998 |
|||||||||||
|
Risk Assessment Finding |
|||||||||||
|
Disposition of Child Abuse/Neglect Investigation |
No Significant Risk Factor Identified |
Risk Factor Controlled |
Risk Indicated |
Not Applicable |
Blank/Invalid |
Total |
|||||
|
Confirmed |
414 |
17,380 |
11,761 |
120 |
91 |
29,766 |
|||||
|
Unconfirmed |
27,732 |
42,411 |
5,040 |
2,886 |
3,312 |
81,381 |
|||||
|
Total |
28,146 |
59,791 |
16,801 |
3,006 |
3,403 |
111,147 |
|||||
|
Percent Confirmed |
1.5% |
29.1% |
70.0% |
4.0% |
2.7% |
26.8% |
|||||
|
CPS Case Action |
|||||||||||
|
Disposition of Child Abuse/Neglect Investigation |
No Significant Risk Factor Identified |
Risk Factor Controlled |
Risk Indicated |
Not Applicable |
Blank/Invalid |
Total |
|||||
|
Opened for Service |
N/A |
N/A |
13,239 |
N/A |
N/A |
13,239 |
|||||
|
Not Opened for Service |
28,146 |
59,791 |
3,562 |
3,006 |
3,403 |
97,908 |
|||||
|
Total |
28,146 |
59,791 |
16,801 |
3,006 |
3,403 |
111,147 |
|||||
|
Percent Opened for Service |
N/A |
N/A |
78.8% |
N/A |
N/A |
11.9% |
|||||
|
Children in Need of Services* Who Receive Services |
|||||||||
|
Year |
Services Provided |
No Services Provided |
Total |
||||||
|
FY 1992 |
44,231 |
26,354 |
70,585 |
||||||
|
FY 1993 |
37,420 |
30,655 |
68,075 |
||||||
|
FY 1994 |
37,389 |
24,749 |
62,138 |
||||||
|
FY 1995 |
34,791 |
22,116 |
56,907 |
||||||
|
FY 1996 |
38,065 |
24,475 |
62,540 |
||||||
|
FY 1997 |
30,279 |
6,490 |
36,769 |
||||||
|
FY 1998 |
34,915 |
8,857 |
43,772 |
||||||
|
*In Need of Services - Determined from completed CPS investigations of child abuse/neglect in which risk was indicated and there are not sufficient family strengths and available resources to provide for the safety to the child in the foreseeable future. |
|||||||||
|
Child Abuse and Neglect Incidence per 1,000 Children In Texas Child Population by Region Fiscal Year 1998 |
|||||
|
Region |
Confirmed Victims |
Alleged Victims |
|||
|
Lubbock (1) |
11.15 |
45.31 |
|||
|
Abilene (2) |
12.02 |
37.64 |
|||
|
Arlington (3) |
7.00 |
28.99 |
|||
|
Tyler (4) |
9.81 |
47.33 |
|||
|
Beaumont (5) |
12.35 |
38.74 |
|||
|
Houston (6) |
7.05 |
26.86 |
|||
|
Austin (7) |
9.86 |
40.21 |
|||
|
San Antonio (8) |
8.68 |
33.10 |
|||
|
Midland (9) |
6.18 |
30.49 |
|||
|
El Paso (10) |
6.90 |
21.26 |
|||
|
Edinburg (11) |
7.24 |
32.52 |
|||
|
State |
8.04 |
23.98 |
|||
|
Alleged and Confirmed Victims of Child Abuse and/or Neglect by Region Fiscal Year 1998 |
|||||||
|
Region |
Alleged Victims |
Confirmed Victims |
Unconfirmed Victims |
Percent Confirmed * |
|||
|
Lubbock (1) |
9,732 |
2,394 |
7,338 |
24.6% |
|||
|
Abilene (2) |
5,162 |
1,649 |
3,513 |
31.9% |
|||
|
Arlington (3) |
41,166 |
9,936 |
31,230 |
24.1% |
|||
|
Tyler (4) |
11,429 |
2,368 |
9,061 |
20.7% |
|||
|
Beaumont (5) |
6,838 |
2,180 |
4,658 |
31.9% |
|||
|
Houston (6) |
34,391 |
9,027 |
25,364 |
26.2% |
|||
|
Austin (7) |
21,298 |
5,223 |
16,075 |
24.5% |
|||
|
San Antonio (8) |
19,366 |
5,079 |
14,287 |
26.2% |
|||
|
Midland (9) |
4,951 |
1,004 |
3,947 |
20.3% |
|||
|
El Paso (10) |
5,232 |
1,697 |
3,535 |
32.4% |
|||
|
Edinburg (11) |
17,775 |
3,959 |
13,816 |
22.3% |
|||
|
Other |
61 |
16 |
45 |
26.2% |
|||
|
State |
177,401 |
44,532 |
132,869 |
25.1% |
|||
|
* Data was updated 04/24/2000 |
|||||||
|
Investigation of Child Abuse and/or
Neglect by Region Fiscal Year 1998
|
|
State Total 111,147 *
|
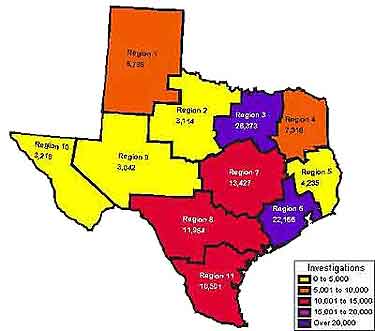 |
*37 investigations had invalid regions
|
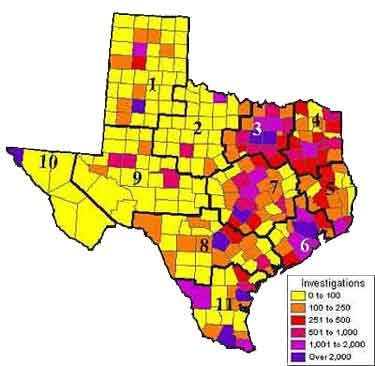
Investigation of Child Abuse and/or
Neglect by County Fiscal Year 1998
|
|
State Total 111,147
|
 |
|
Confirmed Rate of Child Abuse/Neglect Investigations by Region Fiscal Year 1998 |
||||||||||||
|
Region |
Confirmed |
Not Confirmed |
Total |
Percent Confirmed |
||||||||
|
Lubbock (1) |
1,556 |
4,200 |
5,756 |
27.0% |
||||||||
|
Abilene (2) |
1,038 |
2,076 |
3,114 |
33.3% |
||||||||
|
Arlington (3) |
6,831 |
19,542 |
26,373 |
25.9% |
||||||||
|
Tyler (4) |
1,637 |
5,679 |
7,316 |
22.4% |
||||||||
|
Beaumont (5) |
1,390 |
2,845 |
4,235 |
32.8% |
||||||||
|
Houston (6) |
6,244 |
15,922 |
22,166 |
28.2% |
||||||||
|
Austin (7) |
3,530 |
9,897 |
13,427 |
26.3% |
||||||||
|
San Antonio (8) |
3,420 |
8,544 |
11,964 |
28.6% |
||||||||
|
Midland (9) |
636 |
2,406 |
3,042 |
20.9% |
||||||||
|
El Paso (10) |
1,085 |
2,131 |
3,216 |
33.7% |
||||||||
|
Edinburg (11) |
2,389 |
8,112 |
10,501 |
22.8% |
||||||||
|
Other |
10 |
27 |
37 |
27.0% |
||||||||
|
Total |
29,766 |
81,381 |
111,147 |
26.8% |
||||||||
|
Investigations of Child Abuse and Neglect By Source of Report |
|||||||||||
|
Sources |
Fiscal Year 1996 |
Fiscal Year 1997 |
Fiscal Year 1998 |
||||||||
|
Number |
% of Total |
Number |
% of Total |
Number |
% of Total |
||||||
|
Anonymous |
6,857 |
6.9% |
3,657 |
4.8% |
6,953 |
6.3% |
|||||
|
Child-Care Facility |
1,344 |
1.3% |
1,098 |
1.4% |
1,552 |
1.4% |
|||||
|
Law Enforcement |
12,287 |
12.3% |
8,710 |
11.5% |
14,901 |
13.4% |
|||||
|
Parent |
9,315 |
9.3% |
6,793 |
9.0% |
10,914 |
9.8% |
|||||
|
Relative |
10,736 |
10.8% |
7,195 |
9.5% |
12,640 |
11.4% |
|||||
|
School |
19,980 |
20.0% |
14,356 |
19.0% |
22,958 |
20.7% |
|||||
|
Victim |
779 |
0.8% |
418 |
0.6% |
615 |
0.06% |
|||||
|
Medical Personnel |
10,567 |
10.6% |
7,943 |
10.5% |
16,771 |
15.1% |
|||||
|
Friend/Neighbor |
10,335 |
10.4% |
7,217 |
9.5% |
11,890 |
10.7% |
|||||
|
Social Agency ** |
8,959 |
9.0% |
1,917 |
2.5% |
1,433 |
1.3% |
|||||
|
Other |
8,621 |
8.6% |
10,304 |
13.6% |
13,768 |
12.4% |
|||||
|
Unknown |
0 |
0.0% |
6,117 |
8.1% |
6,001 |
5.4% |
|||||
|
Total |
99,780 |
100.0% |
75,725 |
100.0% |
120,396 * |
||||||
|
* Reports of Abuse/Neglect situations may come from multiple sources. Prior to FY 1998 only one source of report was available. (In FY 1998 there were 111,147 CPS Investigations of Child Abuse). |
|||||||||||
|
Confirmed Victims of Child
Abuse and/or Neglect by Region Fiscal Year 1998
|
|
State Total 44,532*
|
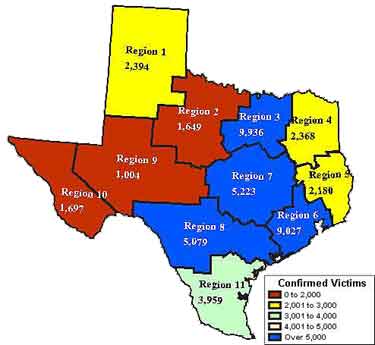 |
* 16 confirmed victims had invalid regions
|
Confirmed Victims of Child
Abuse and/or Neglect by County Fiscal Year 1998
|
|
State Total 44,532*
|
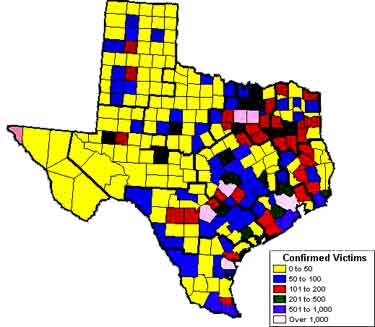 |
* 16 confirmed victims had invalid regions